Imagine trying to read a 1000-page book in an almost foreign language - a jumble of characters with no clear meaning. Interpreting IoT without suitable visualization tools is just as challenging: complex, confusing and difficult to access. IoT collect enormous amounts of data every second - from temperature fluctuations and machine vibrations to movement patterns in the supply chain and production cycles. A veritable flood of information.
But this is where the challenge lies: raw data is only of value if it is made readable, understandable and usable. Unstructured data is merely digital fragments without context. This is exactly where IoT comes in - it transforms the apparent chaos into clear, actionable insights. It is the tool that makes IoT tangible, comparable to a modern "Rosetta Stone" or a "Google translator" for the digital world.
According to Statista, the global volume of IoT is expected to exceed 79 zettabytes by 2025. Without powerful visualization tools, this huge flood of data remains an untapped potential. With the right tools, however, it becomes a valuable source of information that enables new insights and strategic advantages.

What is data visualization in the IoT?
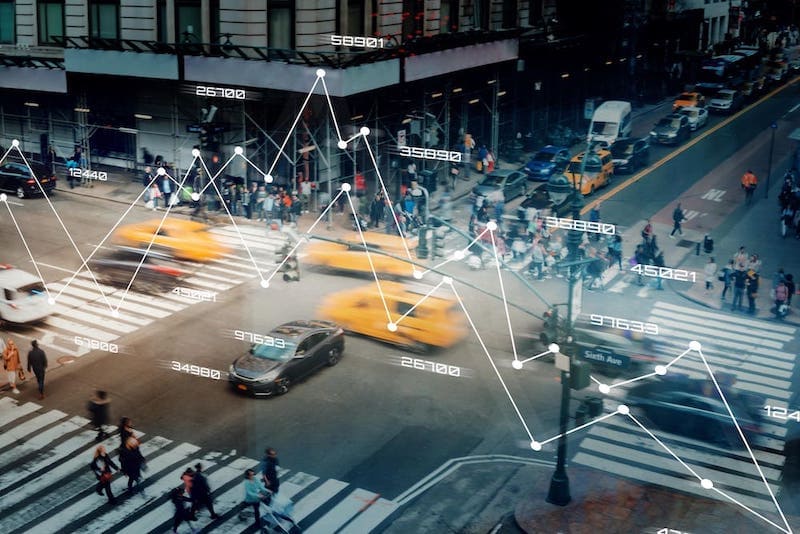
IoT acts as a powerful lens that brings the complex and often overwhelming IoT into razor-sharp focus. It translates chaotic data streams into understandable visualizations - from charts and graphs to interactive dashboards. This enables companies to recognize patterns, trends and anomalies that would have remained hidden in the flood of raw data.
Making complex data sets understandable
IoT can quickly become overwhelming, especially when numerous devices generate thousands of data points simultaneously. Visualization tools enable efficient navigation through these volumes of data and highlight the most relevant information. For example, Microsoft Azure IoT Hub uses intuitive dashboards to display sensor data, allowing users to see device statuses, production rates and supply chain movements at a glance.
Challenges in the interpretation of IoT
Without suitable visualization, deciphering IoT is like trying to read hieroglyphics without a reference - without even knowing that you are working in a foreign language. Different data sources, inconsistent formats and the sheer volume of data can make meaningful analysis difficult. Tools such as Tableau and Power BI enable structured data preparation through real-time analyses and help to bring order to the digital chaos.
The importance of IoT for companies
Revolutionizing production
In the manufacturing industry, IoT is much more than a helpful tool - it's essential. Companies like GE Digital use visualization technologies to monitor machine performance, predict maintenance needs and optimize production processes. By detecting potential failures at an early stage, time, costs and resources can be saved considerably.
Increase in operational efficiency
IoT offers much more than appealing graphics - it creates an intuitive language that enables informed decisions in real time. Interactive dashboards provide precise updates on energy consumption, bottlenecks in the supply chain or production processes. A study by McKinsey shows that effective data visualization can increase operational efficiency by up to 30% by moving companies from reactive to proactive decision-making.
Important functions of the IoT
Real-time dashboards
Modern dashboards offer up-to-the-minute insights and enable immediate action. For example, if a logistics manager detects a delivery delay on a dashboard, they can take immediate action to reroute shipments and avoid costly downtime.
Customizable visualizations
Every company has different data analysis requirements. Customizable IoT allow users to select the exact metrics that are critical to their specific business processes. Siemens MindSphere, for example, offers customized visualization options for various industrial applications, from energy monitoring to device diagnostics.
Best practices for IoT
1. choose the right tools
Not every visualization tool is suitable for IoT. Platforms such as Tableau, Grafana and Power BI are designed to process large data streams in real time without losing performance.
2. ensure user-friendliness
Visualizations should be as intuitive as they are informative. Complex interfaces or dashboards overloaded with technical jargon counteract the purpose of the visualization. A clear, understandable presentation is crucial.
3. plan for scalability
As an IoT expands, the amount of processed data also increases. Visualization solutions should be able to grow with these requirements without sacrificing efficiency. Amazon Web Services (AWS), for example, offers scalable IoT for companies of all sizes.
4. avoid data overload
One of the biggest challenges in IoT is information overload. Too many data points at once can lead to decision blockages. The focus should be on key figures, supplemented by targeted warnings in the event of critical changes.
Future trends in IoT
AI-supported analyses
The integration of artificial intelligence into IoT will further revolutionize data visualization. AI algorithms will recognize patterns and enable predictive analyses that help companies to anticipate developments at an early stage. According to Gartner, 70% of companies are planning to invest in AI-supported visualization solutions in the next three years.
Real-time and interactive visualizations
Future visualization tools will become even more interactive and allow users to adjust filters, analyse data in greater depth and even run simulations. This new generation of visualization not only supports well-founded decisions, but also promotes confidence in data quality.
Conclusion: Making sense of IoT through visualization
From manufacturing plants to logistics centers, IoT is transforming the way companies operate and make decisions. By transforming raw data into understandable and actionable insights, it enables more efficient processes, cost savings and more accurate forecasting. Companies that invest in the right tools, apply best practices and keep an eye on future developments will not only understand IoT- they will be able to use it as a strategic advantage.
Gain valuable insights into your company's data and processes. We will advise you free of charge and without obligation.
